Survivorship Bias: Definition, Examples & How to Avoid It
Survivorship Bias: Definition, Examples & How to Avoid It
For every WWII bomber that limped home riddled with bullet holes, there was another that took a hit in a different spot and never made it back — and for a while, the military almost reinforced the wrong parts of the plane because of it. That’s survivorship bias: drawing conclusions from what’s still around to study, while forgetting about everything that didn’t survive to be counted. It shows up everywhere from mutual fund brochures to “follow your passion” advice, and once you see it, you can’t stop noticing what’s missing from the picture.
What is survivorship bias?
The survivorship bias is the tendency to draw conclusions only from things, people, or cases that made it through some selection process — survived, succeeded, stayed visible — while ignoring the much larger group that didn’t. Whatever failed, disappeared, or got filtered out along the way is invisible in the data, which makes the surviving group look more representative, more replicable, or more informative than it really is.
It’s a specific, well-documented case within the wider family of cognitive biases, closely related to confirmation bias and sitting alongside things like the halo effect and the sunk cost fallacy as a case where the available evidence quietly misleads because of what’s missing from it, not what’s wrong with it.
As a concept, survivorship bias actually started as a statistical and methodological idea — used in epidemiology, engineering reliability testing, and finance long before it became a fixture on popular lists of cognitive biases. In finance specifically, it’s one of the most-cited data problems in the industry: any analysis of “top-performing” funds, stocks, or trading strategies that only looks at entities still trading today is vulnerable to it, which is exactly what Elton, Gruber, and Blake measured directly (see below).
Psychologically, survivorship bias largely piggybacks on the availability heuristic — survivors are the cases you can actually see and count, while failures are often literally gone: the company dissolved, the fund closed, the person was never profiled. When one side of a comparison is invisible by default, the visible side starts to feel like the whole picture, and confirmation bias does the rest, since success stories also tend to be the ones people are motivated to repeat and believe.
The original story: Abraham Wald’s bombers
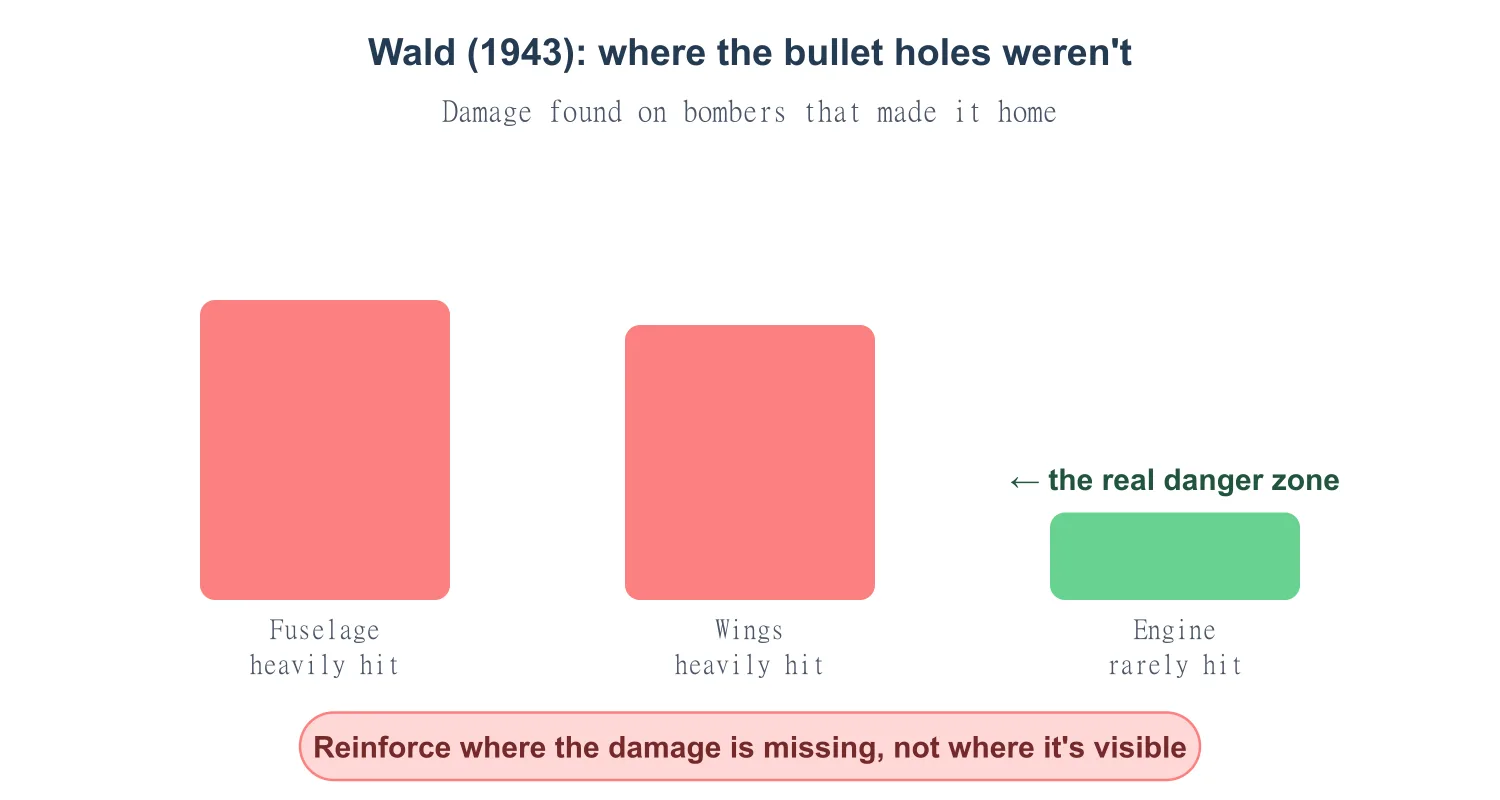
The clearest illustration of survivorship bias comes from World War II. In 1943, the U.S. military was losing too many bombers to enemy fire and brought the problem to the Statistical Research Group at Columbia University, which included the mathematician Abraham Wald. Officers had already mapped where returning bombers were hit hardest — mostly the fuselage and wings — and the obvious plan was to add armor there.
Wald pointed out the flaw: every plane in that dataset had survived being hit in those spots. The damage pattern on returning planes didn’t show where a hit was fatal — it showed where a plane could take a hit and still make it home. Planes hit somewhere else, like the engine, mostly didn’t come back at all, so their damage was invisible in the data. Wald’s recommendation was the opposite of the obvious one: reinforce the areas with the least visible damage, because those were the spots real hits couldn’t be survived.
The twist: measuring it in real money
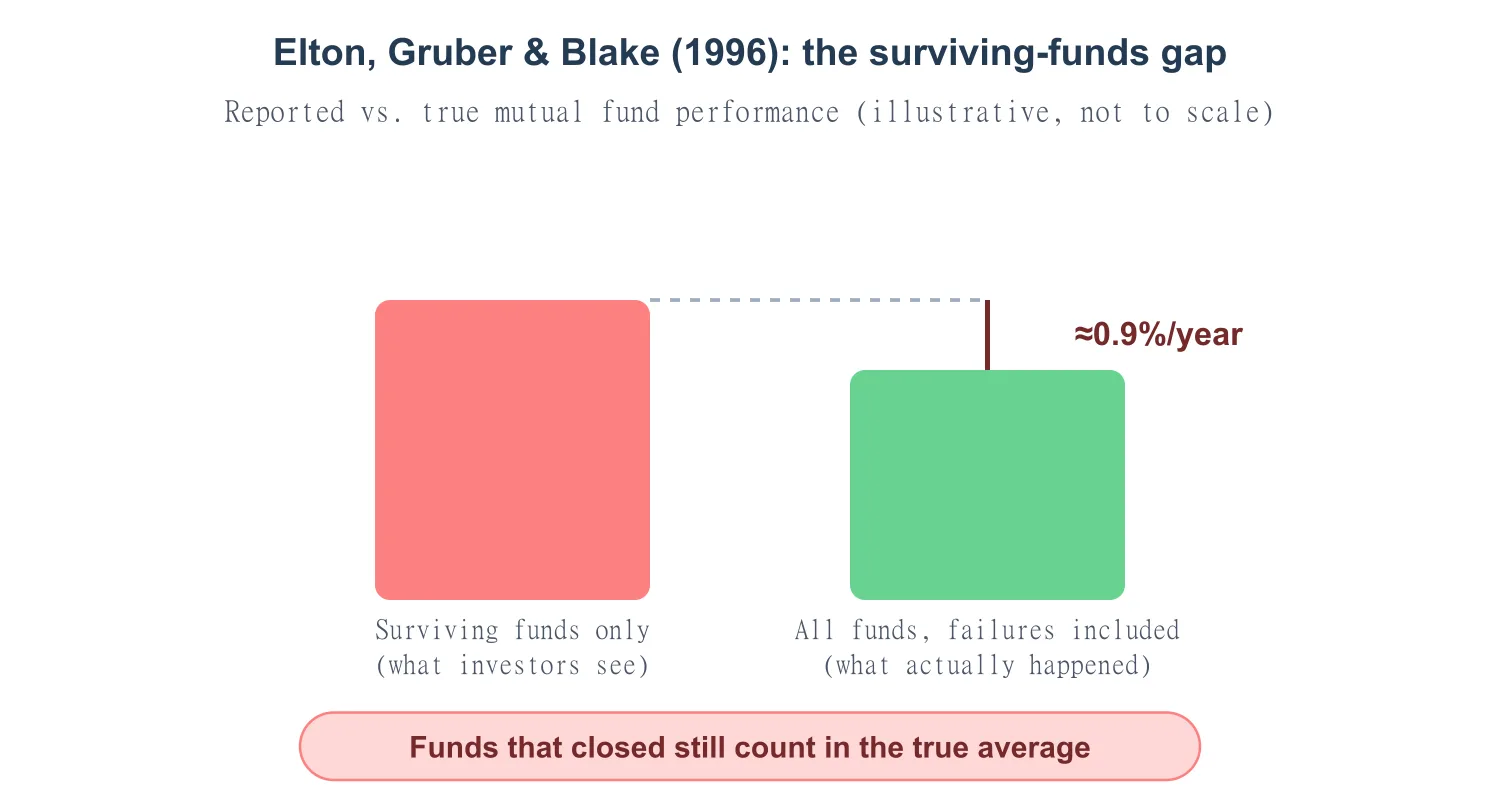
Survivorship bias isn’t just a wartime anecdote — it’s precisely measurable, and one of the clearest demonstrations comes from finance. In a 1996 study published in The Review of Financial Studies, researchers Edwin Elton, Martin Gruber, and Christopher Blake tracked every U.S. mutual fund that existed at the end of 1976, including the ones that later closed or merged out of existence.
Fund performance reports typically only include funds still operating today — the ones that survived. Elton, Gruber, and Blake compared the average returns of that surviving-only group against the average returns of every fund that had actually existed, failures included, and found the surviving-only figure overstated real performance by roughly 0.9% per year. Funds disappear mostly because they perform badly, so leaving them out of the average doesn’t just lose a few data points — it systematically inflates the number investors see.
Survivorship bias vs. selection bias
These terms get used interchangeably, but one is a specific case of the other.
- Selection bias: the broad category — any systematic distortion caused by how a sample was chosen, for any reason.
- Survivorship bias: a specific type of selection bias, where the sample is skewed because it only includes cases that survived, succeeded, or remained observable, with the failures missing.
Every survivorship bias is a selection bias, but not every selection bias involves survival — the “survivorship” version is specifically about who or what stuck around long enough to be counted.
Survivorship bias examples
Survivorship bias examples in real life
- “They don’t build them like they used to”: Old buildings still standing centuries later look impressively durable — but that’s partly because the badly built ones from the same era collapsed or were torn down long ago, leaving only the sturdiest examples for us to admire today.
- Falling cats: A well-known 1987 veterinary study found that cats that fell from lower floors sometimes had worse injuries than cats that fell from higher floors — one proposed explanation is that cats who don’t survive a high fall never make it to a vet clinic to be counted at all.
- “Follow your passion” advice: Profiles of people who quit stable jobs to chase a passion and succeeded rarely come with a comparison group of everyone who did the same thing and failed quietly.
- Historical artifacts and records: What survives to be studied from an era tends to be what was built to last or deemed important enough to preserve, which can skew our picture of the whole era toward its most exceptional examples.
In business
Bestselling business books that study only companies still thriving, without a matched set of companies that used the exact same strategies and failed, make certain strategies look far more reliable than they actually are.
In investing
Backtesting a trading strategy against today’s stock market index tests it only against companies still around — the companies that went bankrupt or got delisted, often for reasons the strategy would have caught too late, are quietly missing from the test.
In career advice
A list of self-made billionaires who skipped college makes dropping out look like a strategy, when the far larger group of college dropouts who didn’t become billionaires never gets interviewed for the article.
In fitness and self-help
Before-and-after transformation stories only feature the people who stuck with a program and got results — everyone who tried the same program and quietly quit isn’t there to be counted in the “success rate.”
How to avoid survivorship bias
- Ask what’s missing, not just what’s in front of you. Before trusting a pattern, ask how the group you’re looking at got selected — and who got filtered out before you ever saw the data.
- Look for the failures on purpose. A success story is only informative next to a comparable failure story — find out what happened to the people or companies that tried the same thing and didn’t make it.
- Distrust datasets that only include “current” or “still active” entries. Anything measured only among survivors — active users, existing companies, standing buildings — is missing exactly the cases most likely to change the conclusion.
- Ask what the base rate actually is. Isolated success stories can’t tell you the odds — only a full accounting of everyone who tried can.
- Watch for it alongside confirmation bias, since a survivorship-biased sample often happens to confirm whatever story is already appealing to tell.
This connects to the broader critical thinking skill of asking what evidence is missing from a data set, not just what conclusions the visible evidence seems to support. Avoiding it comes down to the same move every time, whether the dataset is a fleet of bombers, a decade of mutual fund returns, or a stack of before-and-after photos: actively go looking for the failures that didn’t make it into the picture, because they’re usually the ones with something to teach you.
Keep learning: the full list of cognitive biases, how the sunk cost fallacy distorts decisions in a related way, and the halo effect for another case where one visible detail crowds out the full picture.